Tutorials
PreTestAds scores video ads and static images — upload either one and AdCortex™ tells you how viewers respond. These illustrated tutorials cover everything from your first upload to redesigning weak creatives with Claude Design and squeezing out a higher score.
On this page
- How to score your first ad2 min read
- How to score packaging, banners, and static ads2 min read
- How to read your score3 min read
- The Google Gemini workflow — frame-level coaching3 min read
- The Claude Design workflow — redesign your ad and re-score it4 min read
- Case study: iterating a static image ad from 46% to 76% conversion signal5 min read
- How to score ads from an AI agent (pay-per-call, no account)3 min read
- How to improve a weak or moderate score4 min read
How to score your first ad
Create an account
Sign up at pretestads.com. Choose a plan to get started — credits never expire within your billing cycle and extra packs roll over forever.
Upload your video
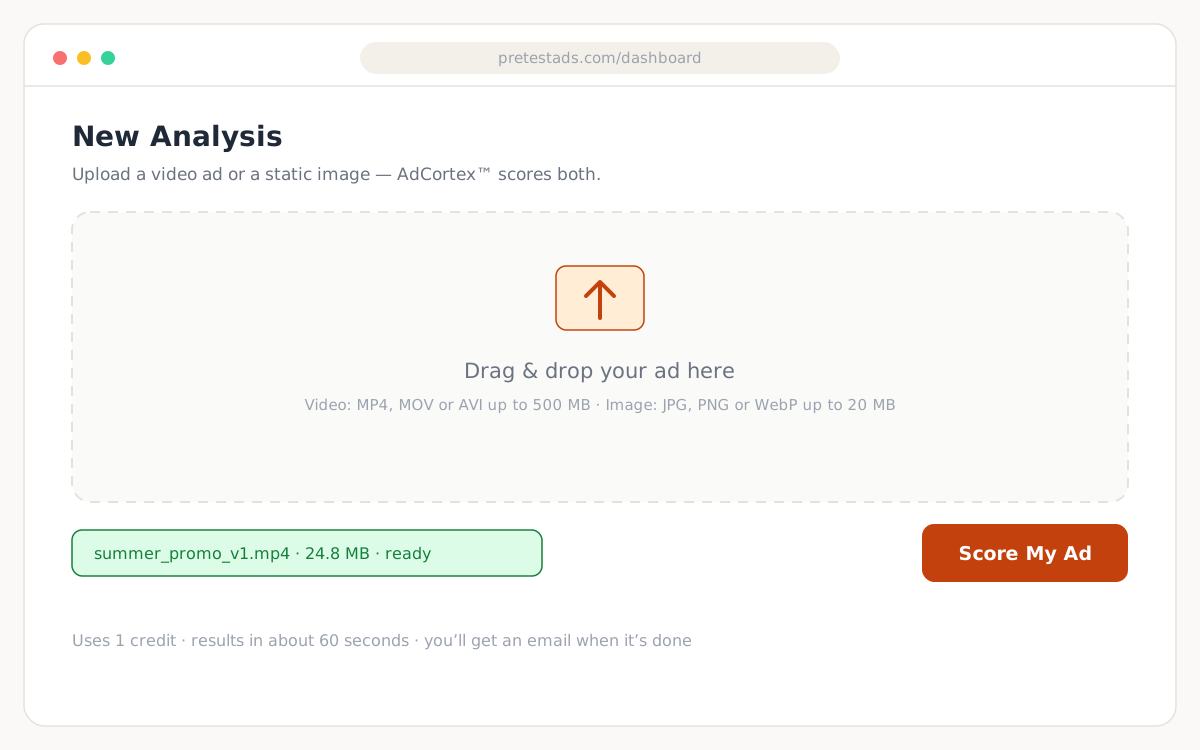
From the dashboard, click New Analysis. Drag and drop your video file (MP4, MOV, or AVI). We accept files up to 500MB.
Wait about 60 seconds
AdCortex™ runs your video through the engagement model, compares it against 76 proven top-performers from the TikTok Creative Center, and builds your full breakdown. You'll get an email when it's done.
Read your results
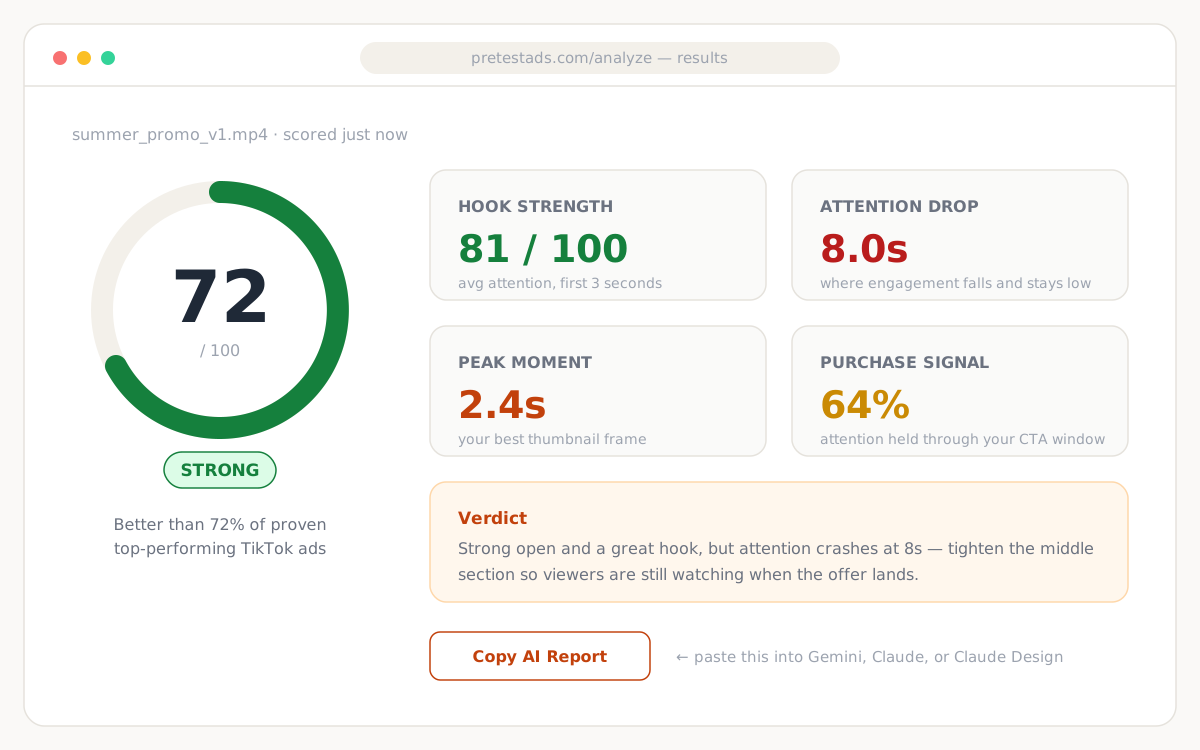
Your score is a percentile — 72 means your ad is better than 72% of proven top-performing TikTok ads on predicted viewer attention. Below the score you'll see your full breakdown: Hook Strength, Attention Drop, Peak Moment, and Purchase Signal.
How to score packaging, banners, and static ads
What image scoring is
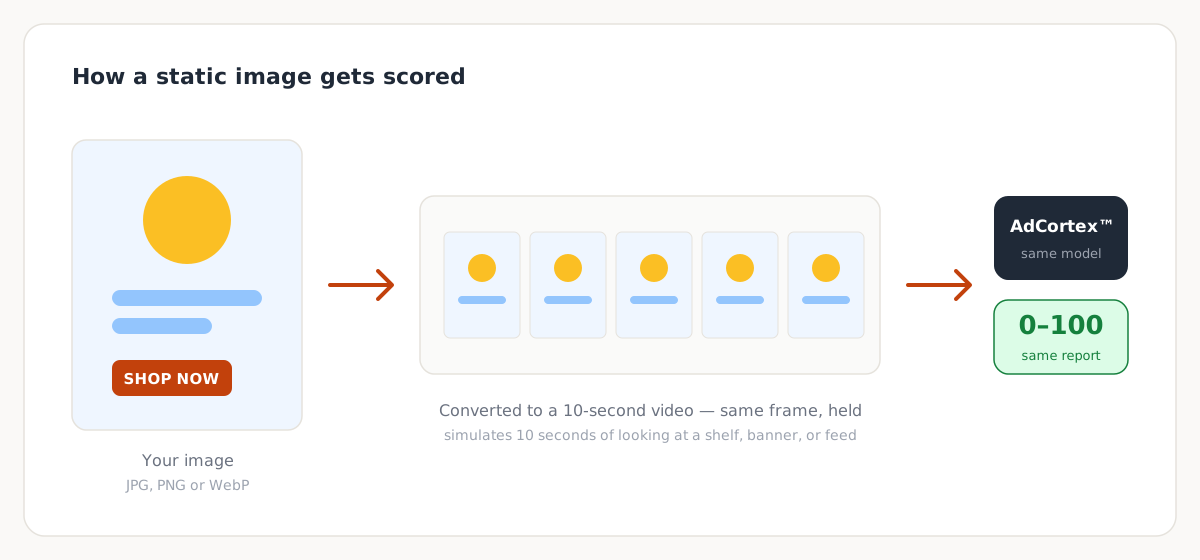
AdCortex™ was built for video — but a static image can be scored too. We convert your image into a 10-second video (the same frame held for 10 seconds) and run it through the same engagement model. This simulates someone looking at your packaging on a shelf, a banner ad on a website, or a print ad in a magazine for 10 seconds.
What file types work
Upload a JPG, PNG, or WebP. Max file size is 20MB. High-resolution images are automatically resized to 1920px on the longest edge before processing — so don't worry about scaling it down yourself.
Upload it the same way as a video
Go to New Analysis and drag your image into the drop zone. You'll see a note that says "Image detected — we'll convert this to a 10-second visual stimulus for scoring." Hit Score My Ad. It uses 1 credit and goes through the same pipeline.
Reading your results
Your results page looks identical to a video analysis. Hook Strength reflects how strongly the image grabs attention in the first 3 seconds of viewing. Since it's a static image, engagement will be flat across the timeline — the absolute level is what matters, not the shape of the curve. A strong score means the image itself is visually engaging.
Best use cases
Use image scoring to compare packaging variations before going to print, test banner ad creatives before buying placements, or score product photography before running it as a static Facebook or Instagram ad. Run multiple versions, pick the highest scorer.
Use an AI chatbot for deeper feedback
Copy your AI Report and open a vision-capable chatbot like Gemini or Claude. Upload your image alongside the report. Ask it: "My image scored weak — what specifically about this design is failing to hold attention, and how should I fix it?" It can see your image and the engagement data together and give you specific design feedback — then regenerate a fixed version with an image model like Claude Design or Higgsfield.
How to read your score
The Creative Strength Score (0–100)
Your score is a percentile rank against 76 TikTok Creator Academy top-performing ads. A score of 60 means your ad outperforms 60% of those proven ads on predicted creative engagement. Strong = 70+. Moderate = 40–69. Weak = below 40.
Hook Strength
The average predicted attention during your first 3 seconds. This is the most important number — if your hook doesn't grab attention immediately, nothing else matters. A weak hook means people are gone before your message even starts.
Attention Drop
The exact second where predicted engagement falls and stays low. This is your scroll risk moment. If it shows up at 4s on a 15s ad, most viewers are mentally checked out before you've said anything. That section needs to be cut or reworked.
Peak Moment
The single highest predicted-engagement frame in your video, excluding the final 2 seconds (which can be a model artifact). This is the moment your ad hits hardest — and the best frame to use as a thumbnail. Jump to that timestamp in your video to grab it.
Purchase Signal
The average predicted attention during the final 30% of your video — your CTA window. A high signal here means viewers are still locked in when you make your offer. A low signal means attention has already dropped off before your offer registers, no matter how good the offer is.
The engagement chart
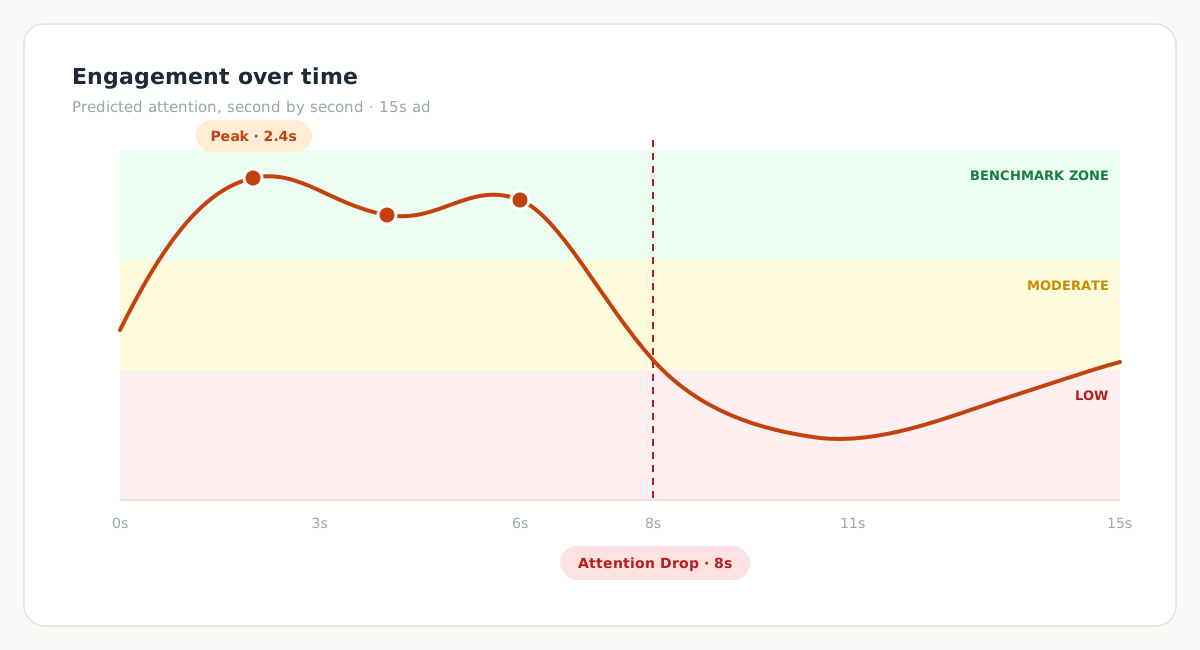
The chart shows activation second by second. Green zone = benchmark-level engagement. Yellow = moderate. Red = low. The drop-off line marks where attention crashes. Peak dots mark your top 3 engagement moments.
The Google Gemini workflow — frame-level coaching
Why Gemini specifically
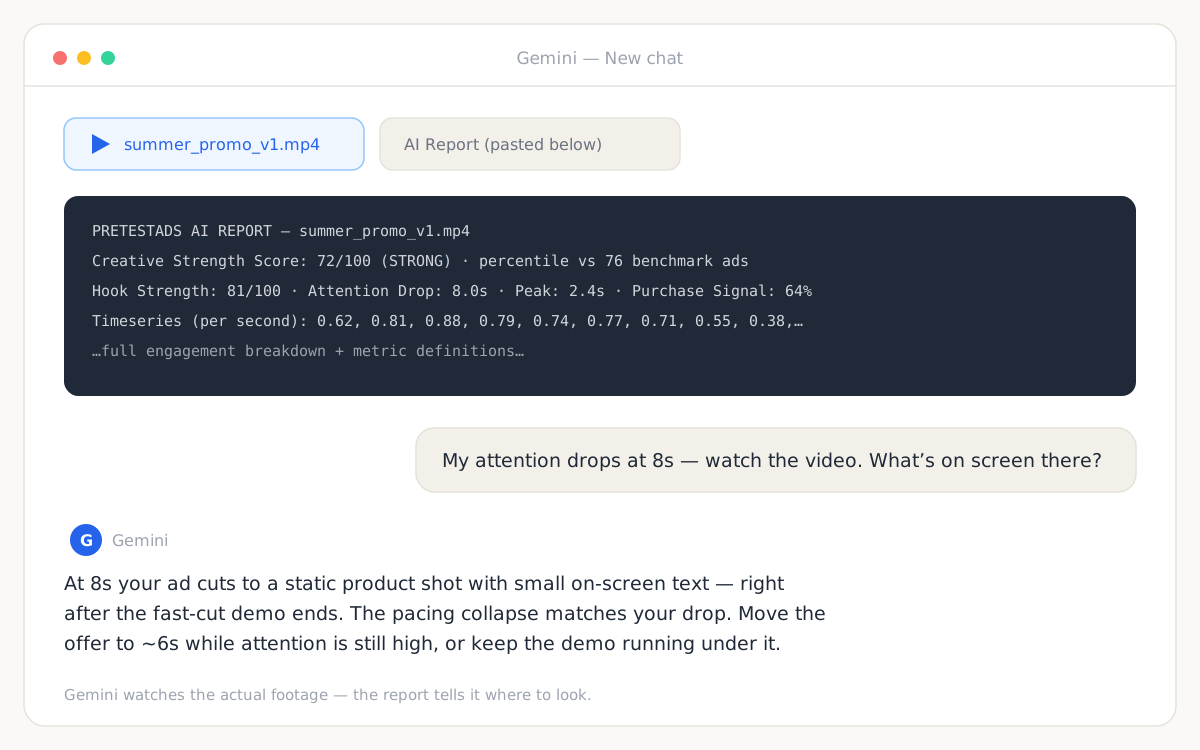
Gemini can watch a full video natively. That means you can show it your actual ad alongside your engagement report and it will connect the two — telling you what is happening on screen at the exact moments your score drops or spikes. Claude and ChatGPT are great for reading the report and coaching on stills, but Gemini's native video understanding makes it the best fit for frame-by-frame video feedback.
Copy your AI Report
At the bottom of your results page, click Copy AI Report. This copies a plain-text version of your full engagement breakdown — score, all four metrics, the full timeseries data, and context about what each number means.
Open Gemini and upload your video
Go to gemini.google.com. Start a new chat. Upload your video file using the attachment button (you'll need Gemini Advanced for video). Then paste your AI Report into the message.
Ask the right questions
Try prompts like: "My attention drops at 8 seconds. What is happening on screen at that moment and how should I fix it?" or "My hook strength is low — watch the first 3 seconds and tell me what is failing." The engagement data tells Gemini where to look; the video tells it what to say.
Use it to iterate
Once you rework your ad based on Gemini's feedback, re-score it in PreTestAds. Track whether your Hook Strength and overall score improve. Repeat until you hit 70+.
The Claude Design workflow — redesign your ad and re-score it
What Claude Design is
Claude Design (claude.ai/design) is Anthropic's visual design tool — a chat on the left, a live canvas on the right. You describe what you want, Claude generates a working design, and you refine it through conversation, inline comments, or by dragging elements directly on the canvas. It's in beta for Claude Pro, Max, Team, and Enterprise plans, on web and desktop. For static ads — banners, packaging, product shots — it's the fastest way to turn a weak PreTestAds score into a redesigned creative you can re-score minutes later.
Step 1 — Score your ad and copy the AI Report
Upload your image to PreTestAds and let AdCortex™ score it. At the bottom of the results page, click Copy AI Report. This is the key move: the report contains your score, all four metrics, and the second-by-second engagement data — it tells Claude exactly what is failing and where, so you get targeted design changes instead of generic advice.
Step 2 — Start a project and give Claude the full picture
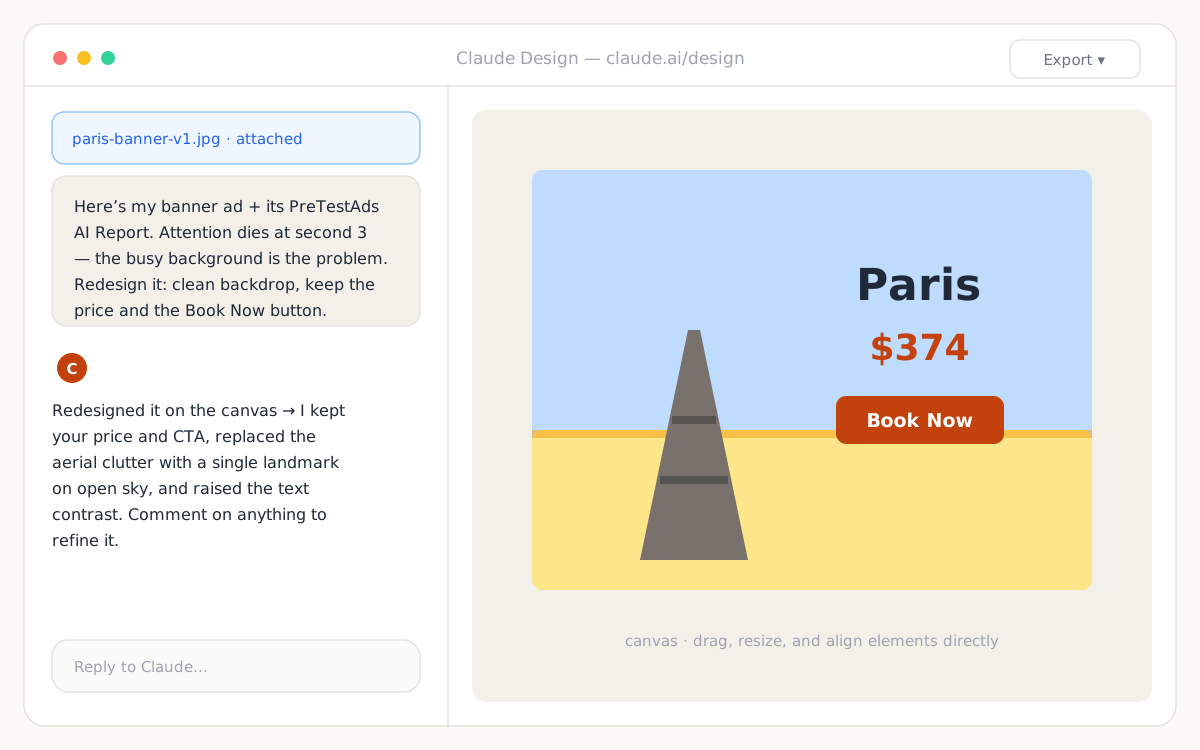
Go to claude.ai/design and create a new project. Attach your ad image, paste the AI Report, and describe the problem in plain language: "Attention dies at second 3 — the busy background is the problem. Redesign it: clean backdrop, keep the price and the Book Now button." Claude generates the redesign directly on the canvas. If you have brand assets or a design system, attach those too — Claude will keep your colors, fonts, and components.
Step 3 — Refine with inline comments
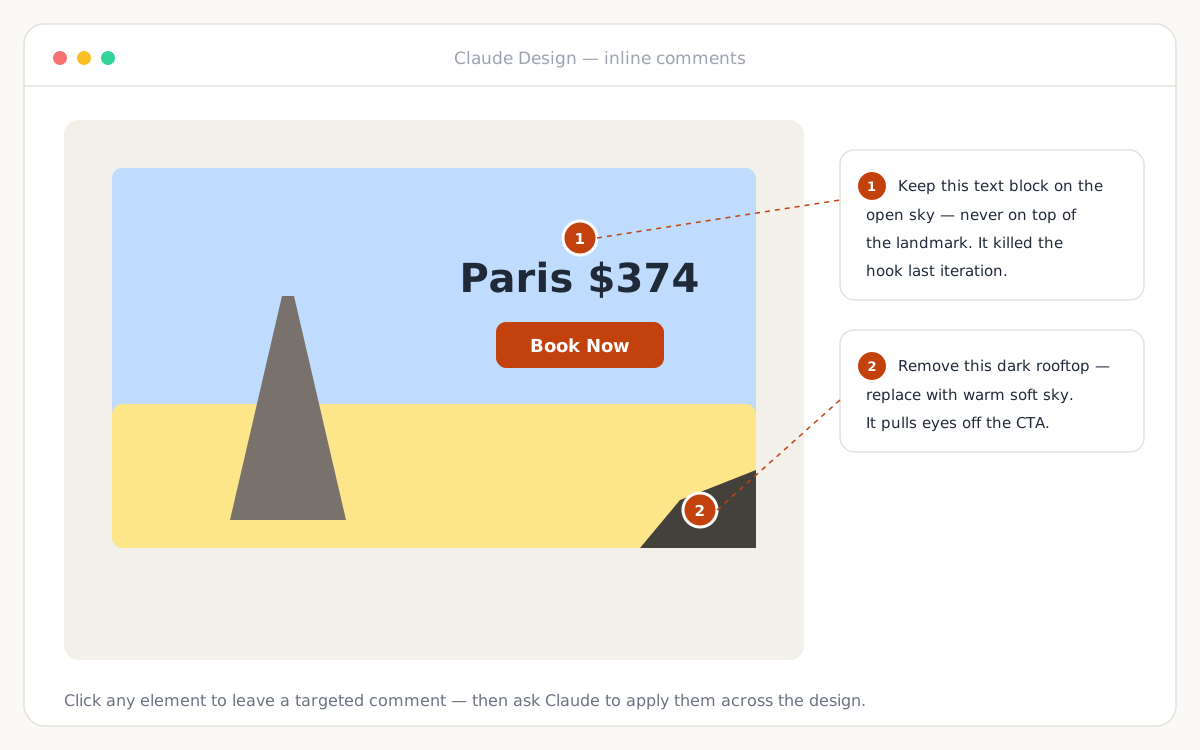
Click any element on the canvas to leave a targeted comment: "Keep this text on open sky — never over the landmark" or "Remove this dark rooftop, it pulls eyes off the CTA." Use chat for structural changes ("show me 2–3 alternative layouts") and drag elements directly for quick fixes. Be specific — "tighten the spacing between the price and the button" beats "this doesn't look right."
Step 4 — Export, re-score, repeat
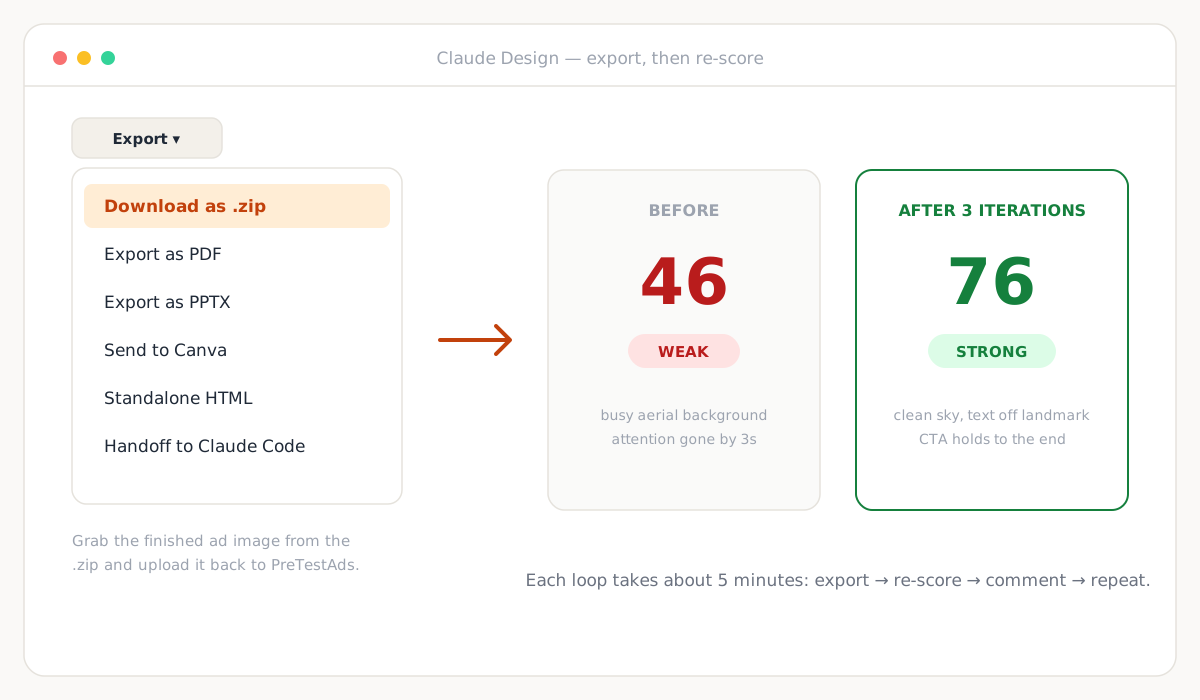
Hit Export in the top-right corner and download your design (the .zip includes the image; PDF, PPTX, Canva, and standalone HTML are also available). Upload the new version to PreTestAds and score it. Feed the new AI Report back into the same Claude Design project and keep iterating. Each loop takes about 5 minutes — in our KAYAK case study below, three loops took the conversion signal from 46% to 76%.
When to use Claude Design vs. Gemini vs. Higgsfield
Use Claude Design when the deliverable is a designed static — banners, packaging, landing-page heroes, static social ads — and you want precise, layout-level control with your own brand system. Use the Gemini workflow when you need frame-level coaching on a video ad. Use an image/video model like Higgsfield when you need new photorealistic footage or imagery rather than a layout redesign. They stack: Gemini diagnoses, Claude Design rebuilds, PreTestAds keeps score.
Case study: iterating a static image ad from 46% to 76% conversion signal
The starting point: a real KAYAK banner ad
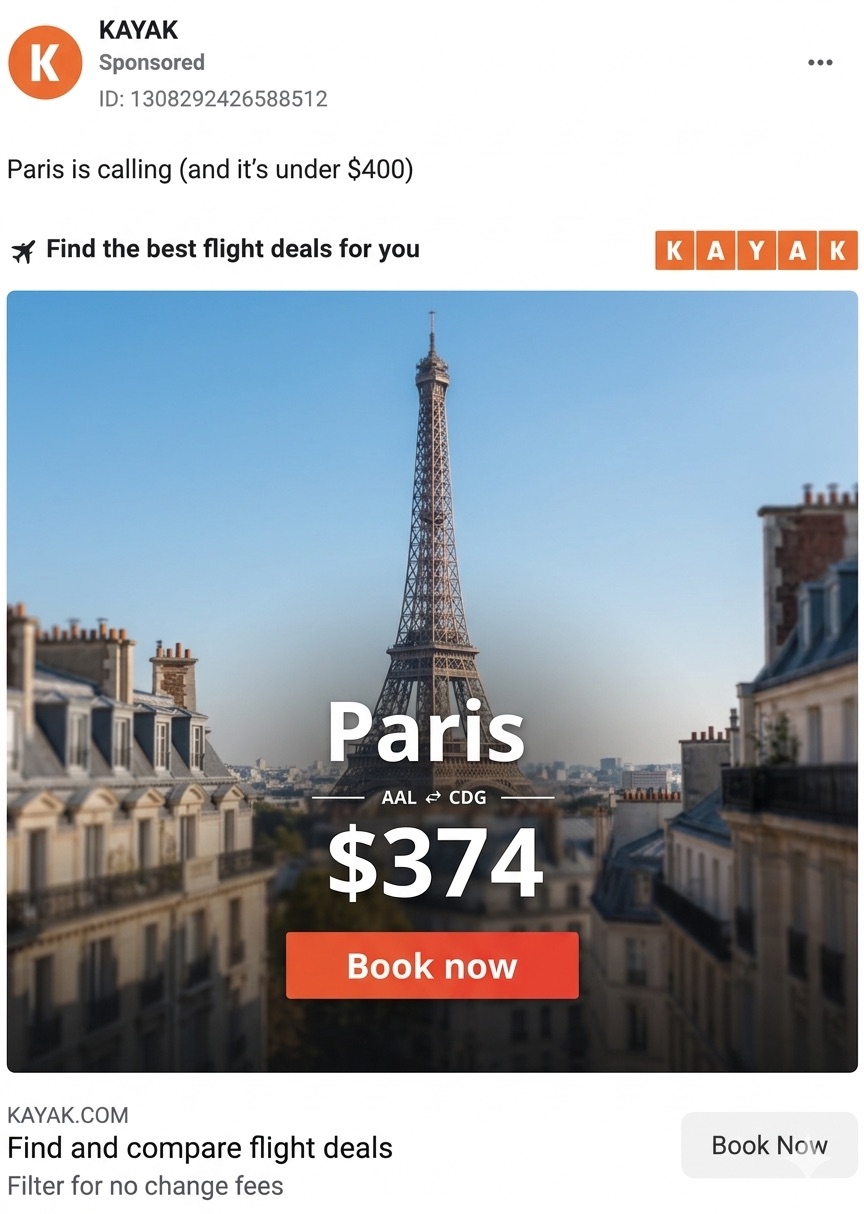
We ran a real KAYAK Paris flight banner through PreTestAds. The image showed a busy aerial cityscape with white text over it reading "Paris $374" and a red Book Now button. Hook Strength came in at 57/100 — solid initial grab. But by second 4, engagement hit 0. Late-window engagement (the conversion signal) was only 46%. Viewers were tuning out before they ever reached the CTA.
What the drop-off was telling us
The Attention Drop at 3 seconds had a clear cause: the aerial background was packed with thousands of tiny buildings and cars. Once viewers finished reading the text, their eyes wandered into the visual noise — and got fatigued. High-complexity backgrounds are one of the most common killers of conversion-window attention. Attention checked out before the offer.
Upload to Gemini with the AI Report
We copied the AI Report from the results page and opened Gemini. We uploaded the original KAYAK image alongside the report and asked: "The attention drops at second 3. What's happening visually at that moment and how should I fix it?" Because Gemini can see the actual image and read the engagement data together, it mapped the drop-off directly to the chaotic aerial background and gave specific design recommendations — not generic advice.
Iteration 1: clean background, wrong text placement
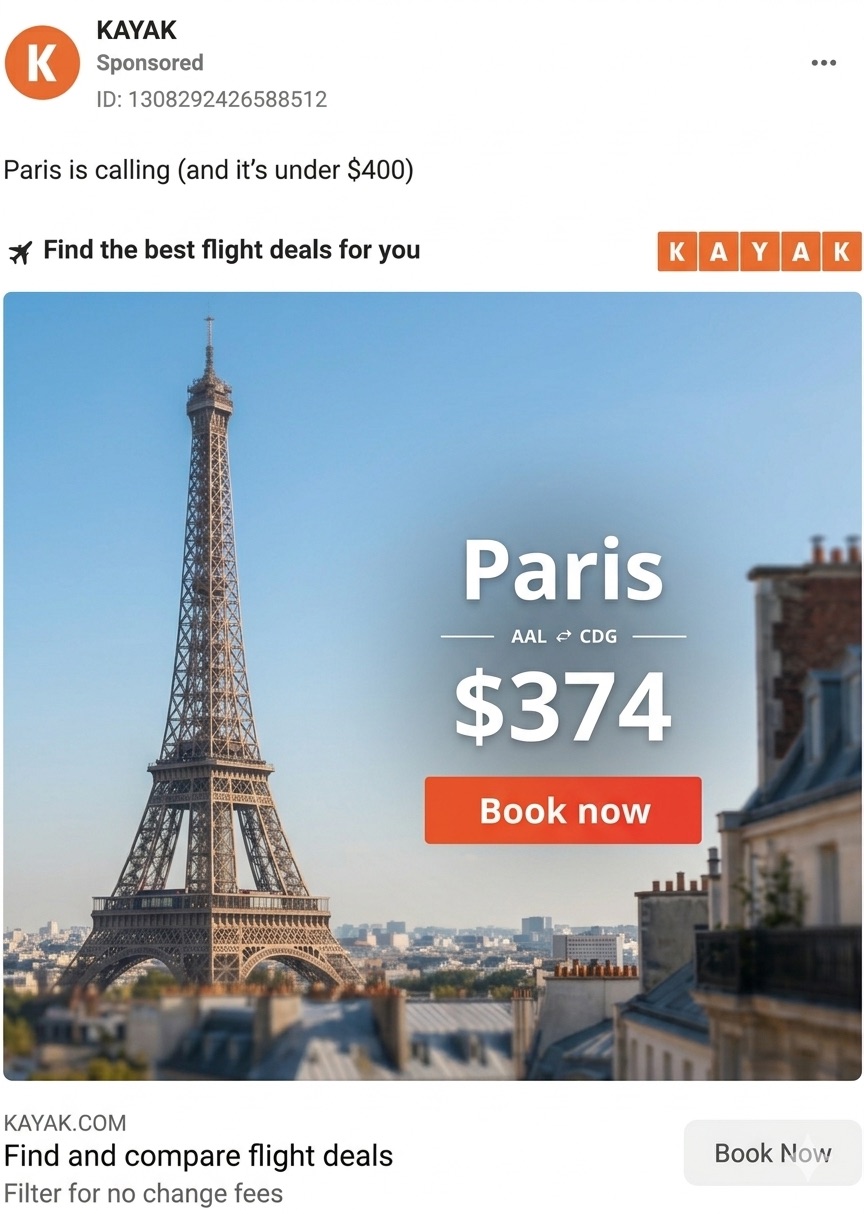
Gemini generated a new version: replaced the aerial cityscape with a clean ground-level Eiffel Tower shot and added a dark vignette behind the text. The conversion signal jumped to 75%. But Hook Strength dropped to 24/100 — the text had been placed directly over the tower, masking the landmark. Viewers couldn't instantly categorize the image in the first second. Better finish, worse start.
Iteration 2: move the text off the landmark
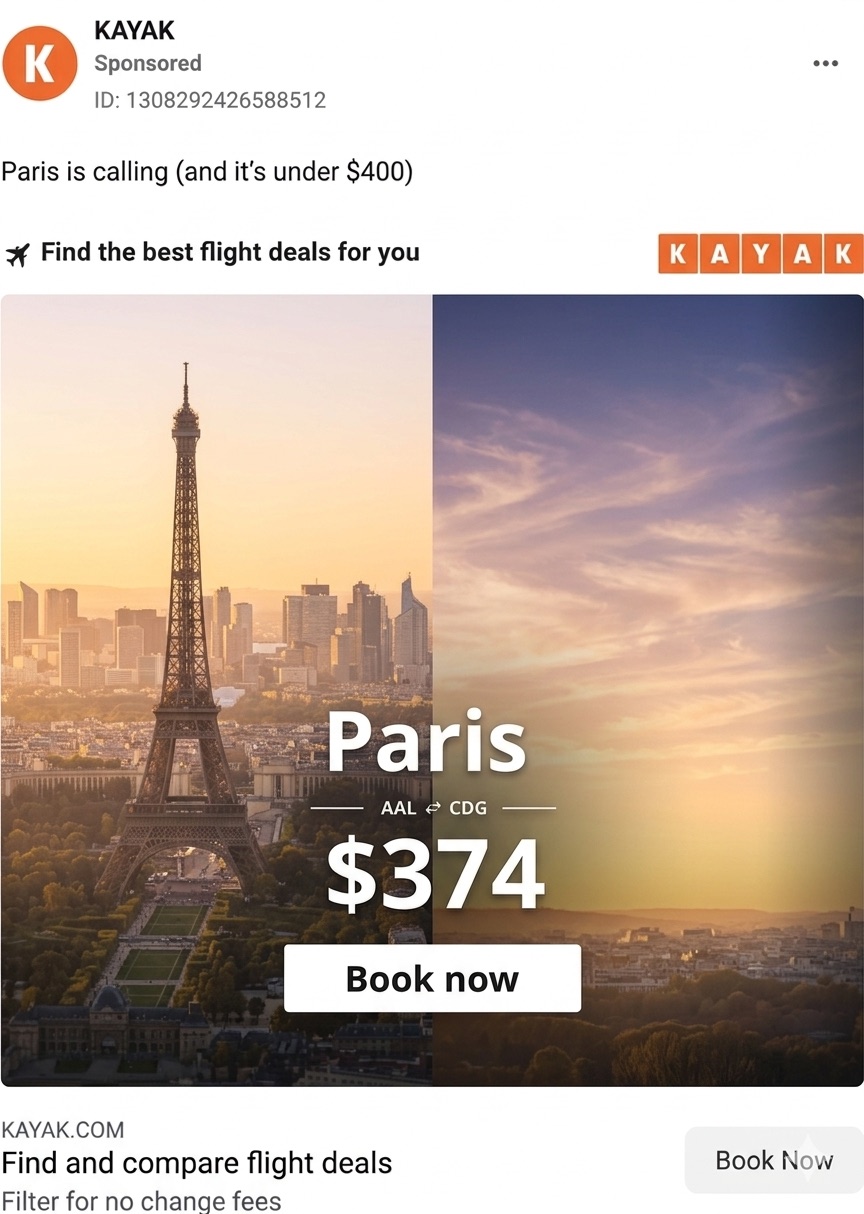
The fix was compositional. We shifted the Eiffel Tower to the left third of the frame and moved the text stack — "Paris / $374 / Book Now" — to the right side against clean open sky. The hook recovered to 72/100 at 0.0s. Late-window activation stayed strong at 82%. Now both the opening grab and the conversion window were working. The remaining drop at seconds 3-4 was identified as a dark rooftop cutting into the bottom right corner.
Iteration 3: remove the foreground distraction
Gemini's final recommendation: remove the dark architectural foreground on the bottom right and replace it with a warmer, softer sky. The result hit 89/100 at 0.0s and late-window activation of 76% with a perfect 100/100 peak at second 8. Viewers were instantly reading the price, not getting distracted, and locking onto the CTA at the end. Three iterations turned a cognitively exhausting ad into a conversion asset.
The takeaway: what a 75% improvement actually means
V1 got people to glance. The final version held their attention through the decision window. Late-window activation went from 46% to 76% — a 65% lift in the engagement signal that precedes a click. The hook trade-off was minimal (-31% on raw hook strength) because the original spike was artificially high due to visual chaos, not genuine clarity. A chaotic ad can grab the eye. A clean ad keeps it.
How to replicate this workflow on your own ads
Score your image in PreTestAds. Copy the AI Report. Open Gemini, upload your image alongside the report, and ask it to explain the specific drop-off. Then regenerate a version with an image model — Claude Design, Higgsfield, or Gemini. Re-score it. Watch the numbers move. Each iteration takes about 5 minutes. Most images show meaningful improvement within 2-3 rounds.
How to score ads from an AI agent (pay-per-call, no account)
What this is
Besides the dashboard, PreTestAds exposes a machine-payable API so an AI agent (or any script) can score an ad on its own — no signup, no login, no API key. Each call costs $5.00 USDC and is paid over the open x402 protocol (HTTP 402 Payment Required). It's ideal for automated creative pipelines, agent tools, and batch scoring.
How payment works (x402)
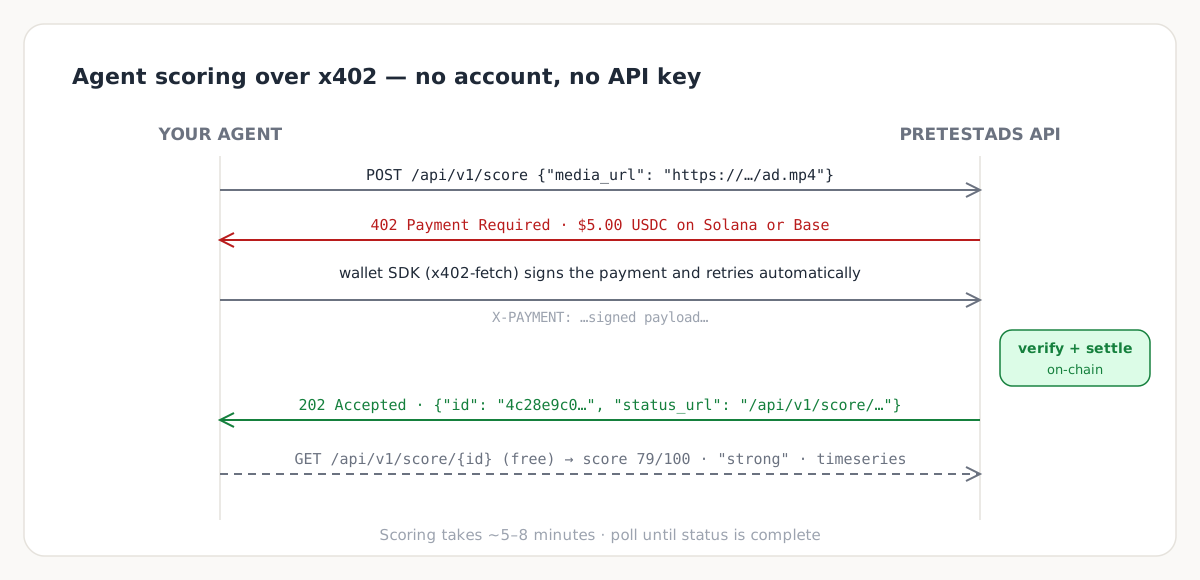
Your agent POSTs the ad to https://pretestads.com/api/v1/score. With no payment attached it gets back a 402 response listing the price and the accepted payment options — $5 USDC on Solana or Base. A buyer wallet SDK (like x402-fetch) signs the payment and retries automatically. The server verifies and settles the payment on-chain before the scoring job runs.
Submit the ad
Send JSON with a public media URL — {"media_url": "https://example.com/ad.mp4", "window_seconds": 15} — or a multipart upload with a file field. Accepted media: MP4/MOV/AVI video or JPG/PNG/WebP image, up to 500MB. On success you get back a job id and a free status URL.
Poll for the result (free)
Scoring runs through the same model as the dashboard and takes about 5-8 minutes. Your agent polls the free GET /api/v1/score/{id} endpoint until status is complete, then reads the 0-100 score, the label (weak/moderate/strong), a plain-language verdict, and the per-second engagement timeseries.
See the full developer guide
The complete walkthrough — a copy-paste x402-fetch quickstart, request/response examples, and notes on discovery — lives on the Score Ads From Your AI Agent guide. A machine-readable summary is also published at /llms.txt for agents that read it automatically.
How to improve a weak or moderate score
Start with the hook (first 3 seconds)
If your Hook Strength is low, nothing else matters yet. Viewers decide in the first 3 seconds whether to keep watching. Try leading with the most visually striking or emotionally surprising moment in your video — don't save the best for later.
Cut to the drop-off point
If Attention Drop shows up early, everything before that point is working — everything after isn't. Trim the dead section entirely or replace it with something faster-paced. Shorter is almost always better.
Move your peak moment earlier
If your Peak Moment is in the second half of your video, you're burying your most engaging content. Try restructuring so that high-activation moment happens in the first 5 seconds.
Shorten your CTA window if Purchase Signal is low
If your Purchase Signal is weak, viewers are mentally gone by the time you make your offer. Either shorten the whole video so the CTA comes before attention drops, or make the offer more immediate — show price, product, or outcome sooner.
Use the Gemini workflow to get specific
General advice only goes so far. Upload your video and AI Report to Gemini and ask it to identify exactly what's on screen when your score drops. Then fix that specific thing, re-score, and see if it moved.
Re-score after every significant edit
Each credit is one analysis. Use them like a testing budget — score your original, make targeted changes, score again. Even a 10-point improvement on Hook Strength can meaningfully change conversion rates.
Go deeper
- What is hook rate?The metric behind Hook Strength.
- Thumb stop ratioBenchmarks from our 76-ad library.
- Ad pre-testing: the complete guideWhere scoring fits in your workflow.
- How to predict ad performanceWhy creative signals forecast results.
- How long should a TikTok ad be?Use the curve to find your cut point.
- Spec ad testingTurn scored spec work into client proof.